Five Number Summary Calculator
To get the result, fill out the calculator form and press the Calculate button.
What is a Five-Number Summary?
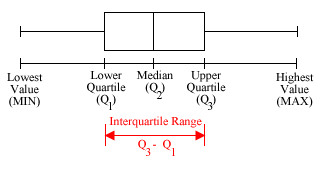
A five-number summary is a set of five summary statistics that provide a concise description of the distribution of a dataset. These statistics are commonly used in descriptive statistics and box-and-whisker plots to help understand the central tendency and spread of a dataset.
Five Number Summary?
- Minimum (Min): The smallest value in the dataset. It represents the lowest data point in the dataset.
- Maximum (Max): The largest value in the dataset. It represents the highest data point in the dataset.
- First Quartile (Q1): Also known as the lower quartile or 25th percentile, Q1 is the value below which 25% of the data falls. It is the median of the lower half of the dataset.
- Median (Q2): The median, also known as the second quartile or 50th percentile, is the middle value of the dataset when it is sorted in ascending order. It divides the dataset into two equal halves, with 50% of the data falling below it and 50% above it.
- Third Quartile (Q3): Also known as the upper quartile or 75th percentile, Q3 is the value below which 75% of the data falls. It is the median of the upper half of the dataset.
Other Calculators
- Standard Deviation Calculator
- Variance Calculator
- Mean Calculator
- Mode Calculator
- Median Calculator
- Arithmetic Mean Calculator
- Harmonic Mean Calculator
- Geometric Mean Calculator
- Mean Absolute Deviation Calculator
- Covariance Calculator
- Correlation Coefficient Calculator
- Sum of Squares Calculator
- Linear Regression Calculator
- Quartile Calculator
- Quadratic Regression
- Five Number Summary Calculator
- Expected Value Calculator
- Chebyshev's Theorem Calculator
- Sample Size Calculator
- Z Score Calculator
- T Test Calculator
- Probability Calculator
- Normal Distribution Calculator
- Confidence Interval Calculator
- Coefficient of Variation Calculator